Overview
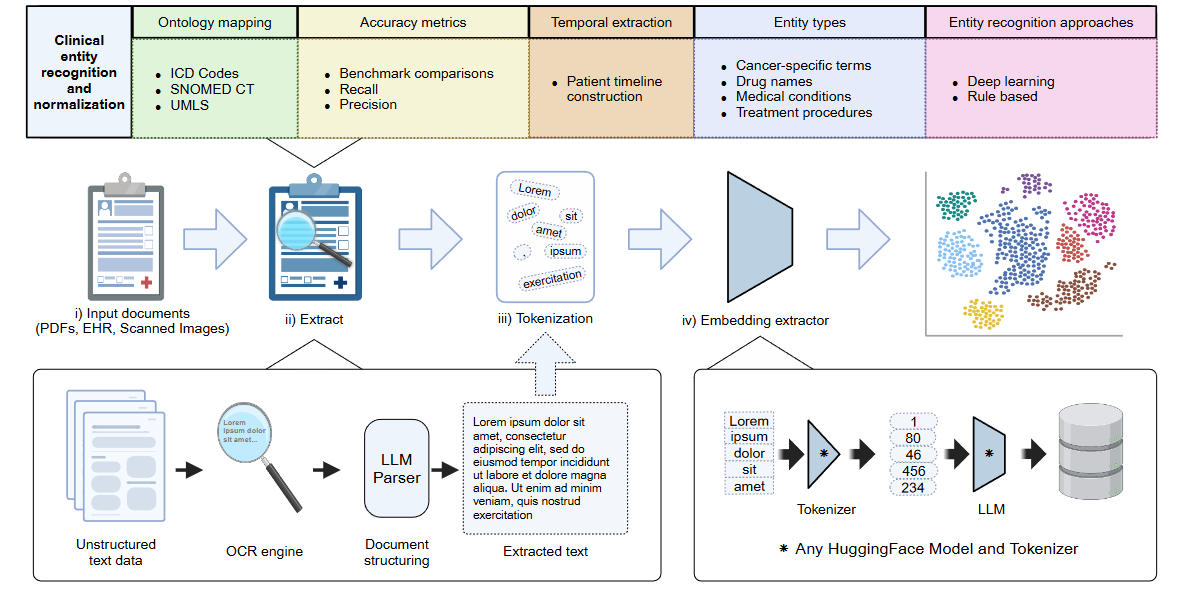
The clinical data processing pipeline in HoneyBee handles clinical text
end-to-end: ingest documents (PDF, scanned images, EHR exports), extract
named entities, detect context (negation, uncertainty), link to medical
ontologies (SNOMED CT, UMLS, BioPortal), build patient timelines, generate
biomedical embeddings, and export FHIR R4 bundles. The
ClinicalProcessor class exposes every step as a standalone
method so you can compose custom pipelines or run the full chain with a
single call via HoneyBee.process_clinical().
Key Features
- Multi-backend PDF/image/EHR ingestion (Unstructured, PyMuPDF, PyPDF2, Tesseract OCR fallback)
- Named entity recognition with 4 backends (
transformer,scispacy,medspacy,medcat) - Context detection — negation, uncertainty, historical, and family flags
- Proximity-based relationship extraction between entities
- Temporal timeline construction with date parsing and entity linkage
- SNOMED CT / UMLS / BioPortal ontology linking via Snowstorm
- 7 biomedical embedding model presets (BioClinicalBERT, PubMedBERT, BioBERT, SciBERT, GatorTron, Clinical-T5, sentence-transformers)
- FHIR R4 transaction bundle export
- High-level
HoneyBee.process_clinical()one-call API
Quick Start
Install HoneyBee and run the full clinical pipeline on a sample note:
from honeybee import HoneyBee

hb = HoneyBee()

clinical_note = """Patient: Jane Doe, 58-year-old postmenopausal female.
Date of Visit: 03/15/2024

History of Present Illness:
Patient was diagnosed with invasive ductal carcinoma of the left breast on 01/10/2024
following an abnormal screening mammogram on 12/05/2023. Core needle biopsy confirmed
Grade 2 moderately differentiated adenocarcinoma. Tumor measures 2.3 cm on imaging.

Biomarker Profile:
ER: positive (95%), PR: positive (80%), HER2: negative (IHC 1+), Ki-67: 22%.

Medications:
Tamoxifen 20 mg daily, Metformin 1000 mg bid, Lisinopril 10 mg daily.

Plan: Begin dose-dense AC-T (doxorubicin/cyclophosphamide x4 followed by
paclitaxel x4) starting 04/01/2024.
"""

result = hb.process_clinical(text=clinical_note)

print(f"Entities:      {len(result.entities)}")
print(f"Relationships: {len(result.relationships)}")
print(f"Timeline: {len(result.timeline)} events")Entities: 63
Relationships: 36
Timeline: 8 eventsDocument Ingestion
HoneyBee can ingest clinical PDFs directly — it tries multiple extraction backends (Unstructured, PyMuPDF, PyPDF2) and falls back to Tesseract OCR for scanned documents. Here we download a sample pathology report from the honeybee-samples dataset and process it end-to-end.
from huggingface_hub import hf_hub_download

# Download sample clinical PDF from HuggingFace
pdf_path = hf_hub_download(
    repo_id="Lab-Rasool/honeybee-samples",
    filename="sample.PDF",
    repo_type="dataset",
)
print(f"Downloaded: {pdf_path}")

# Process the PDF through the full clinical pipeline
pdf_result = hb.process_clinical(document_path=pdf_path)

# Show extraction metadata
meta = pdf_result.document.metadata
print(f"Extraction method: {meta.get('extraction_method', 'unknown')}")
print(f"Pages: {meta.get('num_pages', 'N/A')}")
print(f"Text length: {len(pdf_result.document.text):,} chars")
print(f"Entities: {len(pdf_result.entities)}")
print(f"Relationships: {len(pdf_result.relationships)}")Downloaded: .../datasets--Lab-Rasool--honeybee-samples/.../sample.PDF
Extraction method: pypdf2
Pages: 1
Text length: 1,470 chars
Entities: 21
Relationships: 4Extracted Entities
Each entity is a ClinicalEntity with typed spans
(condition, medication, procedure,
measurement, temporal, anatomy,
dosage), a confidence score, context flags
(is_negated, is_uncertain,
is_historical, is_family), and optional
ontology_codes.
from collections import Counter

entities = result.entities
type_counts = Counter(e.type for e in entities)

# Show entity type distribution
for etype, count in type_counts.most_common():
    print(f"  {etype:<14s}: {count}")

# Top-15 entities
print(f"\n{'Text':>35s}  {'Type':<12s}  {'Conf':>5s}")
print("-" * 58)
for e in entities[:15]:
print(f"{e.text[:35]:>35s} {e.type:<12s} {e.confidence:>5.2f}") procedure : 24
medication : 14
measurement : 10
condition : 7
temporal : 4
dosage : 4
Text Type Conf
----------------------------------------------------------
58-year-old temporal 0.88
ductal carcinoma condition 1.00
Grade 2 measurement 0.98
Tumor condition 1.00
HER procedure 0.99
Lisinopril medication 0.97
chemotherapy medication 1.00
radiation oncology procedure 0.87
chemotherapy medication 0.92
chemotherapy procedure 0.83Annotated Clinical Note
The same entities shown inline in the original text — each highlight corresponds to an entity type detected by the NER pipeline.
Generate this visualization in Python
Reproduce the annotated note above from a process_clinical()
result in a Jupyter notebook:
from html import escape
from IPython.display import HTML, display
entities = result.entities
# Colour per entity type (alphabetical order)
palette = {
"condition": "#a8d8ea", "dosage": "#ffcfdf",
"measurement": "#fefdca", "medication": "#c3bef7",
"procedure": "#cadefc", "temporal": "#f7d794",
}
# Resolve overlapping spans — keep earlier / longer
sorted_ents = sorted(entities, key=lambda e: (e.start, -(e.end - e.start)))
keep, last_end = [], -1
for e in sorted_ents:
if e.start >= last_end:
keep.append(e)
last_end = e.end
# Build annotated HTML
parts, prev = [], 0
for e in keep:
if e.start > prev:
parts.append(escape(clinical_note[prev:e.start]))
bg = palette.get(e.type, "#d5dbdb")
tip = f"{e.type} (conf {e.confidence:.2f})"
parts.append(
f'<span style="background:{bg};padding:1px 3px;border-radius:3px"'
f' title="{tip}">{escape(clinical_note[e.start:e.end])}</span>'
)
prev = e.end
if prev < len(clinical_note):
parts.append(escape(clinical_note[prev:]))
# Legend
legend = " ".join(
f'<span style="background:{c};padding:2px 8px;border-radius:3px">{t}</span>'
for t, c in palette.items()
)
display(HTML(
f'<div style="font-family:monospace;font-size:13px;line-height:1.8;'
f'white-space:pre-wrap;max-width:900px">{"".join(parts)}</div>'
f'<div style="margin-top:12px">{legend}</div>'
))Cancer-Specific Entities
The clinical note describes breast cancer with biomarkers (ER+, PR+, HER2−),
staging (T2N1M0, Stage IIB), and tumor type (invasive ductal carcinoma). The
default transformer NER backend maps these to generic types.
We can filter for oncology-relevant entities by matching known cancer terms.
# Define oncology keyword categories
CANCER_KEYWORDS = {
    "tumor": ["carcinoma", "adenocarcinoma", "cancer", "tumor",
              "ductal", "invasive", "glioblastoma"],
    "biomarker": ["ER", "PR", "HER2", "Ki-67", "EGFR", "ALK",
                  "PD-L1", "Oncotype", "GFAP", "MIB-1"],
    "staging": ["T2N1M0", "Stage", "Grade", "metastasis"],
    "treatment": ["doxorubicin", "cyclophosphamide", "paclitaxel",
                  "tamoxifen", "pembrolizumab", "chemotherapy", "radiation"],
}

# Filter entities
print(f"{'Entity Text':>35s}  {'NER Type':<12s}  {'Onc. Category':<14s}")
print("-" * 65)
for e in entities:
    for cat, keywords in CANCER_KEYWORDS.items():
        if any(kw.lower() in e.text.lower() for kw in keywords):
            print(f"{e.text[:35]:>35s}  {e.type:<12s}  {cat:<14s}")
break Entity Text NER Type Onc. Category
-----------------------------------------------------------------
ductal carcinoma condition tumor
Grade 2 measurement staging
Tumor condition tumor
chemotherapy medication biomarker
radiation oncology procedure treatment
chemotherapy medication biomarker
chemotherapy procedure biomarker Tip: Configure the scispacy or medspacy
backend for dedicated tumor, biomarker, and
staging entity types.
Context Attributes
Each entity carries four boolean flags that capture how it appears in clinical narrative:
| Flag | Meaning | Example |
|---|---|---|
is_negated | Explicitly denied | "no evidence of distant metastasis" |
is_uncertain | Hedging language | "possible pneumonia" |
is_historical | Past event | "history of hypertension" |
is_family | Family member | "mother had breast cancer" |
The default transformer backend does not perform context
detection. Enable the medspacy backend
(pip install medspacy) for automatic detection via ConText:
# Default transformer backend — no context flags set
sample = entities[0]
print(f"Entity: {sample.text!r}")
print(f"  is_negated:    {sample.is_negated}")
print(f"  is_uncertain:  {sample.is_uncertain}")
print(f"  is_historical: {sample.is_historical}")
print(f"  is_family:     {sample.is_family}")

# Enable context detection with medspacy
hb = HoneyBee(config={"clinical": {"ner": {"backends": ["medspacy"]}}})Entity: '58-year-old'
is_negated: False
is_uncertain: False
is_historical: False
is_family: FalseEntity Relationships
The processor detects proximity-based relationships between entities (medication–dosage, condition–treatment, tumor–staging, etc.).
print(f"{'Source':>30s}  {'Relation':<18s}  Target")
print("-" * 80)
for rel in result.relationships[:12]:
    src = rel.get("source_text", entities[rel["source_idx"]].text)[:30]
    tgt = rel.get("target_text", entities[rel["target_idx"]].text)[:30]
print(f"{src:>30s} {rel['type']:<18s} {tgt}") Source Relation Target
--------------------------------------------------------------------------------
ductal carcinoma temporal_relation /2024
/2024 temporal_relation screening
mamm has_result Grade 2
needle biopsy has_result Grade 2
needle biopsy investigated_by adenocarcino
3 cm has_result CT
CT temporal_relation 02/01/2024
scan temporal_relation 02/01/2024Patient Timeline
Dates are extracted from the text and linked to nearby clinical entities to build a chronological patient timeline.
timeline = result.timeline

print(f"{'Date Text':>15s}  {'Parsed':>12s}  Related Entities")
print("-" * 75)
for ev in timeline:
    related = [entities[i].text[:25] for i in ev.related_entities
               if i < len(entities)]
    label = ", ".join(related[:3])
    if len(related) > 3:
        label += f" (+{len(related) - 3})"
print(f"{ev.date_text:>15s} {str(ev.date)[:10]:>12s} {label}") Date Text Parsed Related Entities
---------------------------------------------------------------------------
12/05/2023 2023-12-05 ductal carcinoma, screening, mamm (+8)
01/10/2024 2024-01-10 ductal carcinoma, screening, mamm (+5)
02/01/2024 2024-02-01 adenocarcino, Tumor, 2 (+8)
02/20/2024 2024-02-20 positive, positive, HER (+13)
03/15/2024 2024-03-15 ductal carcinoma
03/15/2024 2024-03-15 ductal carcinoma
03/25/2024 2024-03-25 tam, tase inhibitor, chemotherapy (+1)
04/01/2024 2024-04-01 AC, do, or (+5)The timeline can be visualized as a scatter plot using matplotlib, with events positioned chronologically and labeled with their most relevant clinical entities.
FHIR Export
Convert the processing result into a FHIR R4 transaction Bundle. Entity
types map to FHIR resources: conditions to Condition,
medications to MedicationStatement, measurements to
Observation.
import json

bundle = hb.clinical_processor.to_fhir(result, patient_id="patient-001")

entries = bundle.get("entry", [])
resource_types = Counter(e["resource"]["resourceType"] for e in entries)
print(f"Bundle: {bundle['resourceType']}  ({len(entries)} entries)")
for rtype, count in resource_types.most_common():
    print(f"  {rtype:<25s}: {count}")

print(f"\n--- Sample Condition resource ---")
print(json.dumps(entries[0]["resource"], indent=2))Bundle: Bundle (32 entries)
MedicationStatement : 14
Observation : 10
Condition : 7
DiagnosticReport : 1
--- Sample Condition resource ---
{
"resourceType": "Condition",
"code": {
"text": "ductal carcinoma"
},
"clinicalStatus": {
"coding": [
{
"system": "http://terminology.hl7.org/CodeSystem/condition-clinical",
"code": "active"
}
]
},
"subject": {
"reference": "Patient/patient-001"
}
}Ontology Linking
HoneyBee can link extracted entities to standard medical ontologies
(SNOMED CT, RxNorm, LOINC, ICD-10). The Snowstorm backend
queries the free
SNOMED International terminology server
— no API key needed. Each entity gains an ontology_codes
list of OntologyCode(system, code, display, source_api) objects.
# Re-process with Snowstorm ontology linking enabled
hb_onto = HoneyBee(config={"clinical": {"ontology": {"backends": ["snowstorm"]}}})
result_onto = hb_onto.process_clinical(text=clinical_note)

coded = [e for e in result_onto.entities if e.ontology_codes]

if coded:
    print(f"{'Entity':>30s}  {'System':<12s}  {'Code':<14s}  Display")
    print("-" * 90)
    for e in coded[:15]:
        oc = e.ontology_codes[0]
        print(f"{e.text[:30]:>30s}  {oc.system:<12s}  {oc.code:<14s}  {oc.display[:35]}")
    print(f"\n{len(coded)} / {len(result_onto.entities)} entities linked")
else:
    print("Snowstorm returned 0 codes (public server may be rate-limiting).")
Note: The public Snowstorm server enforces rate limits. If many entities time out, try again later or point to a local Snowstorm instance:
hb = HoneyBee(config={"clinical": {"ontology": {
    "backends": ["snowstorm"],
    "snowstorm_base_url": "http://localhost:8080/snowstorm/snomed-ct",
}}})
Biomedical Embeddings
Generate dense vector representations with pre-configured biomedical language models:
Available Models
| Preset | Description |
|---|---|
bioclinicalbert | Clinical BERT trained on MIMIC-III notes (default) |
pubmedbert | BERT trained on PubMed abstracts |
biobert | BioBERT for biomedical text mining |
scibert | SciBERT trained on scientific publications |
gatortron | Clinical foundation model (gated) |
clinicalt5 | T5 fine-tuned on PubMed Central |
sentence-transformers | Lightweight general-purpose sentence embeddings |
Generate Embeddings
import numpy as np

# Single model
emb = hb.generate_embeddings(clinical_note, modality="clinical",
                              model_name="bioclinicalbert")
print(f"bioclinicalbert: shape={emb.shape}, norm={np.linalg.norm(emb):.2f}")

# Multi-model comparison
for name in ["bioclinicalbert", "pubmedbert", "biobert", "scibert"]:
    e = hb.generate_embeddings(clinical_note, modality="clinical", model_name=name)
print(f"{name:>20s}: shape={e.shape}, norm={np.linalg.norm(e):.2f}")bioclinicalbert: shape=(1, 768), norm=10.75
bioclinicalbert: shape=(1, 768), norm=10.75
pubmedbert: shape=(1, 768), norm=13.51
biobert: shape=(1, 768), norm=9.34
scibert: shape=(1, 768), norm=11.22Embedding Similarity
Compare how different clinical text segments relate to each other using cosine similarity:
segments = [
    "invasive ductal carcinoma Grade 2",
    "breast cancer T2N1M0 Stage IIB",
    "ER positive PR positive HER2 negative",
    "tamoxifen 20 mg daily",
    "doxorubicin cyclophosphamide paclitaxel",
    "hemoglobin 11.2 albumin 3.8",
    "non-small cell lung cancer EGFR positive",
    "carboplatin paclitaxel pembrolizumab",
]

seg_emb = hb.generate_embeddings(segments, modality="clinical",
                                  model_name="bioclinicalbert")
norms = np.linalg.norm(seg_emb, axis=1, keepdims=True)
norms = np.where(norms == 0, 1, norms)
similarity = (seg_emb / norms) @ (seg_emb / norms).T

# Print top-5 most similar pairs (excluding self-similarity)
pairs = []
for i in range(len(segments)):
    for j in range(i + 1, len(segments)):
        pairs.append((similarity[i, j], segments[i][:30], segments[j][:30]))
pairs.sort(reverse=True)

print("Top-5 most similar segment pairs:")
for sim, a, b in pairs[:5]:
    print(f"  {sim:.3f}  {a}  <->  {b}")
A cosine similarity heatmap can be generated with matplotlib to visualize the full pairwise similarity matrix across all segments.
Batch Processing
Process multiple notes and compare aggregate statistics. For file-based
workflows, use hb.process_clinical_batch(input_dir=..., file_pattern="*.pdf").
comparison_note = """Patient: John Smith, 65-year-old male.
Diagnosed with stage IIIA non-small cell lung cancer (adenocarcinoma) on 06/15/2024.
EGFR: positive, ALK: negative, PD-L1: positive (75%).
Started on carboplatin 450 mg iv plus paclitaxel 200 mg iv q3w on 07/01/2024.
Pembrolizumab 200 mg iv q3w added as immunotherapy.
CT scan on 09/15/2024 showed partial response.
"""

result2 = hb.process_clinical(text=comparison_note)

# Side-by-side summary statistics
for label, r in [("Jane Doe (breast)", result), ("John Smith (lung)", result2)]:
    stats = hb.clinical_processor.get_summary_statistics(r)
    print(f"--- {label} ---")
    print(f"  Text length:    {stats['text_length']:,} chars")
    print(f"  Entities:       {stats['num_entities']}")
    print(f"  Entity types:   {dict(stats['entity_types'])}")
    print(f"  Relationships:  {stats['num_relationships']}")
    print(f"  Timeline:       {stats['num_timeline_events']} events")
print()--- Jane Doe (breast) ---
Text length: 1,853 chars
Entities: 63
Entity types: {'temporal': 4, 'condition': 7, 'procedure': 24, 'measurement': 10, 'medication': 14, 'dosage': 4}
Relationships: 36
Timeline: 8 events
--- John Smith (lung) ---
Text length: 355 chars
Entities: 27
Entity types: {'temporal': 5, 'condition': 2, 'procedure': 5, 'measurement': 4, 'medication': 7, 'dosage': 4}
Relationships: 44
Timeline: 3 eventsOutput Structure
result.to_dict() serializes the full pipeline output to a
JSON-compatible dictionary — the canonical format for saving results,
feeding downstream models, or exporting to external systems.
import json

output = result.to_dict()

print("Top-level keys:", list(output.keys()))
print(f"  text:          {len(output['text']):,} chars")
print(f"  sections:      {len(output['sections'])} sections")
print(f"  metadata:      {output['metadata']}")
print(f"  entities:      {len(output['entities'])} items")
print(f"  relationships: {len(output['relationships'])} items")
print(f" timeline: {len(output['timeline'])} items")Top-level keys: ['text', 'sections', 'metadata', 'entities', 'relationships', 'timeline']
text: 1,853 chars
sections: 0 sections
metadata: {'source_type': 'text', 'document_type': 'unknown'}
entities: 63 items
relationships: 36 items
timeline: 8 itemsEntity Schema
{
  "text": "58-year-old",
  "type": "temporal",
  "start": 19,
  "end": 30,
  "confidence": 0.88,
  "properties": {
    "backend": "transformer",
    "label": "Age"
  },
  "is_negated": false,
  "is_uncertain": false,
  "is_historical": false,
  "is_family": false,
  "ontology_codes": []
}
Timeline Event Schema
{
  "date": "2023-12-05T00:00:00",
  "date_text": "12/05/2023",
  "sentence": "Patient was diagnosed with invasive ductal carcinoma...",
  "related_entities": [2, 4, 5, 6, 7, 8, 9, 10, 11, 12, 13]
}
Multimodal Integration
integrate_embeddings() concatenates embeddings from different
modalities into a single fused vector:
clinical_emb = hb.generate_embeddings(clinical_note, modality="clinical",
                                       model_name="bioclinicalbert")
pathology_emb = np.random.randn(1, 1536)   # e.g., UNI2 output
radiology_emb = np.random.randn(1, 768)    # e.g., RAD-DINO output

integrated = hb.integrate_embeddings([clinical_emb, pathology_emb, radiology_emb])

print(f"Clinical:   {clinical_emb.shape}")
print(f"Pathology:  {pathology_emb.shape}")
print(f"Radiology:  {radiology_emb.shape}")
print(f"Integrated: {integrated.shape}")Clinical: (1, 768)
Pathology: (1, 1536)
Radiology: (1, 768)
Integrated: (1, 3072)Configuration Reference
NER Backends
| Backend | Install | Notes |
|---|---|---|
transformer | included | Default; HuggingFace token-classification model |
scispacy | pip install scispacy + model | Biomedical NER via spaCy |
medspacy | pip install medspacy | Adds negation/uncertainty context detection |
hb = HoneyBee(config={"clinical": {"ner": {"backends": ["transformer", "medspacy"]}}})Ontology Resolution
| Backend | Requires |
|---|---|
snowstorm | Free SNOMED CT server (no key needed) |
umls | UMLS_API_KEY env var or config |
bioportal | BIOPORTAL_API_KEY env var or config |
hb = HoneyBee(config={"clinical": {"ontology": {"backends": ["snowstorm"]}}})API Embeddings
Use any provider supported by litellm instead of local models:
hb = HoneyBee(config={"clinical": {"embeddings": {
    "mode": "api",
    "model": "ollama/nomic-embed-text",
    "api_base": "http://localhost:11434",
}}})
Performance Considerations
When processing clinical datasets, consider the following:
- Batch processing: Use
process_clinical_batch()for large document collections - GPU acceleration: Embedding models benefit from
device="cuda"when available - Ontology caching: Snowstorm results are cached with LRU (1,000 entries by default) to reduce repeated lookups
- Rate limiting: The public Snowstorm server enforces rate limits; use a local instance for high-volume processing
- Multiple NER backends: Combining backends (e.g.,
transformer+medspacy) increases entity coverage but adds latency